 |
Articles
1 Oct 2012 Statistics on Service for Analysts and a Critical Look at CAD Market StudiesNikolay Snytnikov From David Levin, the editor-in-chief of isicad.ru/isicad.net: Nikolay Snytnikov wrote these notes to reflect upon the article “Cyon Research Compares Russian and Global Trends of CAD Use (with comments by isicad)” published in July and a follow-up hot discussion, that was casting doubts upon (if not ridiculing) statistical validity of the article conclusions, based on “ridiculously small samples”, as some discussion participants were convinced. Back in July, I promised that we would counter those doubts not only with the authority of Cyon Research President, Brad Holtz, but also with substantial comments.
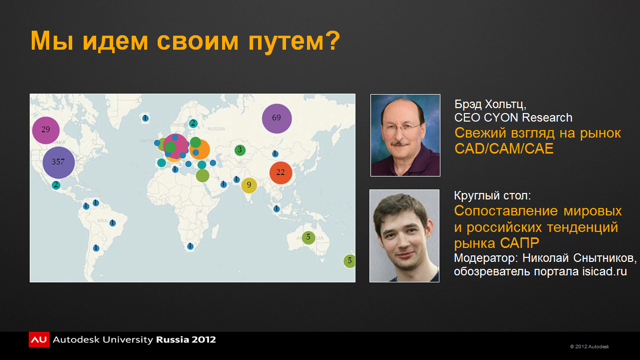
Such comments are especially useful today, just a week before Brad Holtz himself will present new analytical data at Autodesk University Russia, in Moscow (October 3, 14:30-14:55, Hall 11 - “Round Tables”, “A Fresh Perspective of CAD/CAE/PLM/BIM Market”). Immediately after Brad Holtz’s event, the author of these comments, Nikolay Snytnikov, , together with Brad, will moderate a ROUND TABLE (the same location, 15:30 – 16:25), on “Comparing Global and Russian CAD Markets”
“There are three kinds of lies: lies, damned lies and statistics” - this phrase, attributed to a 19th-century British Prime-Minister Benjamin Disraeli, was popularized by Mark Twain. It indicates an understandable phenomenon: a wrong interpretation of pure statistical data is not only fraught with incorrect conclusions but also a dangerous illusion of their rigorous mathematical validity.
Alas! A hundred years later the reputation of applied statistics has not changed much in the eyes of laymen. There are several reasons: many studies are not conducted at a professional level, while others, on the contrary, professionally "make” the data to fit the desired results; and, finally, not fully competent readers are unable to understand some studies correctly.
Not surprisingly, due to the above-mentioned and other historical reasons many Russians seem to extrapolate their unfortunate experience and tend to suspect machinations and “fooling” attempts event in completely harmless analytical publications simply because they use statistical methods and rely on actual data.
Generally speaking, in many professional communities a critical attitude towards published materials is received with a hot welcome. However, it is assumed that criticism must be constructive, methodologically correct and should be based on scientific analysis rather that “common sense”, which according to another classic, sometimes is just a set of prejudices gained before a person had reached 18.
In view of the above, it is easy to understand why a large part of the readers, who had a look at “Cyon Research Compares…,” took its conclusions with some mistrust and even militant skepticism, in passing discovering some ceremonial-magic meaning in the figure 69.
Albert Einstein and Mark Twain strongly recommend taking figures carefully and exercising judgment in interpreting the “common sense” argumentsuments
Certainly, the authors of the Article are somewhat responsible for the situation because they did not explain the methodology of their research in sufficient detail. We will try to bridge the gap: first we will discuss a couple of typical problems of conducting surveys, well-known to any practicing sociologist or marketing consultant, and then give some explanations by Brad Holtz and isicad.ru, compiled as answers to frequently asked questions.
Does the Size Matter?
What is the size of a sample necessary to adequately evaluate distribution parameters? Interestingly, at this stage everyday intuition and logic may fail even technical specialists with advanced degrees. To better picture the values we are talking about, it will be useful to resolve the following problem.
Problem. Let us suppose there is a sampled population of all Russian CAD users; of which N users are randomly selected. It is established that one third of the users from the sample use the X system (where X is, say, Autodesk Inventor, T-Flex CAD, KOMPAS, SolidWorks or whatever). One should find a confidential interval for a fraction of X system on the market with 0.95 reliability. The answer must be given for three different N: A) 69, B) 357 C) 670.
Since this is a typical problem for a standard course on “the probability theory and mathematical statistics”, we shall omit formulas and references to using the central limit theorem, binominal distribution or Laplace’s function, and give the answers right away:
- (A) [0.233, 0.45]
- (B) [0.286, 0.383]
- (C) [0.3, 0.37].
You may see that the process rigorously converges, and for 357 respondents the margin error is within 5%. To verify the answer, it is possible to set up an experiment at home, throwing a coin or a die (although if you are a follower of Persi Diaconis, the results may be not in favor of the probability theory).
Unfortunately, a reverse problem – to determine the sample size for a survey – is more complex and implies introduction of some hypotheses regarding the required parameters of an unknown distribution. On the one hand, as an initial approximation it is possible to estimate that 10% margin error requires 100 random respondents; 5% - 400 respondents and 3% – 1000 respondents. On the other hand, purely statistical estimates of a margin of error are not always useful in practice, because it is very difficult to ensure that a sample is random, and errors brought in by a lack of randomness do not decrease with an increased number of non-random respondents.
In short, there should be very compelling arguments to increase the sample to 1000 and more.
Is Mathematical Statistics Sometimes Useless?
Some mathematicians and engineers can hardly believe it, but the methods of mathematical statistics are far from being the only tool of sociological or marketing research. Expert surveys, interviewing, content-analysis, focus groups and many others are developed specifically as the instruments of qualitative analysis – to reveal trends, consistent patterns, and generate hypotheses – and may need a considerably smaller pool of respondents. Also the type of many research projects means that the answer can be given in a freer form that is required by mathematical statistics. By no means all interesting problems can be formulated in the form of “which CAD is used at the moment” or “who will you vote for at the forthcoming elections”.
For instance, to study the trends in development of software engineering, it can be more useful to have intensive talks with several dozen COFES visitors and several Heads of large PLM vendors instead of asking questions to over 1000 statistically average engineers. Although, this is a debating point.
What Can be More Important Than the Size?
A specialist on social surveys will certainly ask “how was the sample formed?” and “how the questions were formed?” even before hearing anything about the sample size. An interesting observation: many sociology students who managed to continue their studies to the forth year can be confused with the basic concepts of mathematical expectations or dispersion; nevertheless, they firmly know that the key to success is to correctly design a survey sample. Sampling (who to ask and where), formulation of questions (what to ask) and subsequent processing of the results are quite important here. We should hardly hope for objective results, for instance, collecting statistics on market allocation between different CADs and carrying out a survey of the Internet-forum of SolidWorks users. It is also wrong to evaluate political tastes of all citizens of Russia based on the opinions of the visitors of a blog of some hardcore oppositional corruption-fighter.
One of the well-known historical examples of such a fiasco is the poll carried out by the Literary Digest magazine before 1936 presidential elections in the U.S. Polling 2.5 million respondents; the final margin error was 20%. Literary Digest sent questionnaires according to a list of telephone users, not taking into consideration that the lucky telephone owners were well-to-do residents who traditionally were more likely to support Republicans. Amazingly, if the magazine were to randomly survey only 50 individuals from the street, the polling results could have been more accurate!
In 1936 Roosevelt won. Statistics, however, undeservedly got yet another cloud on its reputation.
Being armed with such simple considerations, it is now possible to explain the methodology in more detail.
Methodology: Questions and Answers
Can 69 be considered a representative sample? What about 357 or 690?
isicad.ru:
Such problem presentation is not very correct. The answer depends on the research objective, on how the questions are formulated, how the sample is formed. If a question implies an exact answer, to calculate the average key figures with 5% margin error, a random sample of around 400 respondents is required. As for the article in question, the overall number of respondents across the globe was 670, in the USA - 357 and in Russia - 69. Broadly speaking, if the sample were used to determine the statistical significance of some indicators, the size of the sample for the USA and the entire world would be adequate, and for Russia the error would be around 10%.
However, the above statistical estimates are not applicable to the survey in an explicit form:
- First, the survey objective was not to establish statistical significances
- Second, a random sample was not used
- Finally, 69 Russian respondents were not analyzed separately from the whole sample, and it was analyzed only how Russian data correlate with the global data. For this purpose a much smaller number of respondents can be sufficient.
Perhaps to increase survey representativeness it is necessary to make arrangements with a certain company so all its engineers fill in the questionnaire?
isicad.ru:
It is not simply meaningless but even harmful. Questions given by engineers would be most likely based on the specifics of an individual enterprise. As a result, the evaluated indicators will be strongly biased.
What was the survey objective?
Brad Holtz:
What we are trying to do is to identify correlations in the data that look interesting and that may lead to practical insights into the user community. These correlations are only the first step in a process of research. When we do find a correlation, we ask: "Is this correlation interesting or enlightening in any way". If it is, then the next thing is to identify whether the correlation is an artifact due to our specific cross-section of respondents.
For example, we may have a preliminary finding that shows CEOs responded in a way that is unexpected. In our data, the majority of respondents who are CEOs come from smaller firms. Therefore, we must first identify if the correlation is also related to firm size and then make a determination if it is the firm size, the role, or both that is the major contributor to the correlation. As we indicated earlier, this is not a random sampling of respondents. Because of this, we dedicate fully half of the survey questions to better understand who is responding so that we can perform the appropriate correlation analysis. One of these questions we ask is what software is in use. The fact that we have more respondents with Inventor than with Solid Edge says nothing about the relative market share about the two products. All that it means is that we have a richer set of data on Inventor users than on Solid Edge users and that we can filter the former at a much finer level of granularity than the latter.
Once we have found an interesting correlation that is not an artifact of the data, then we have to analyze the meaning of the correlation. Does it reinforce something we expected or is it counter to our intuition? What might be the causes behind the correlation? More importantly, what are the implications? If there are strong, actionable implications behind the correlations, we may then launch into the next stage of research, which is to actually talk to the participants and get a deeper, qualitative understanding of the results.
What is the Next Research Step?
On October 3, at Autodesk University in Moscow, Brad Holtz will present a new stage of Cyon Research survey. Immediately after his presentation there will be Round Table where participants will be able to discuss the entire spectrum of questions: whether Russia has its own way, what is the global state of the CAD market and, certainly, which direction we are moving.
See also:
Permanent link :: http://isicad.net/articles.php?article_num=15629

|
 |